

Before you begin, make sure you have:
- A workspace created and configured
- At least one environment linked to the workspace
- Workspace Admin or Maintainer role
What You’ll Build
Step 1 - Deploy an Input Connector
An Input Connector receives data from an external system and injects it into your pipeline.- Navigate to your Workspace → click Connectors in the left sidebar
- Click + Add Connector
- Select Input as the connector role
- Choose your connector type (e.g. Kafka, HTTP, Teltonika, Pub/Sub)
- Fill in the required configuration fields:
- Title - a unique name for this connector
- Output Topic - the Kafka topic this connector will publish data to
- Environment Variables - credentials, endpoints, or protocol settings
- Click Deploy
Once deployed, your Input Connector will appear as a block on the Pipeline canvas and begin publishing data to the configured output topic.
Step 2 - Add a Transform
A Transform processes messages as they flow between your Input and Output connectors.Option A - Prebuilt Transform
- On the Pipeline canvas, click + Add Transform
- Select Prebuilt
- Choose a transform type:
- Geofence - location-based event triggering
- Alert Utility - trigger alerts when a condition is met
- Split Utility - route messages based on rules
- Configure the required parameters:
- Input Topic - must match the Output Topic from your Input Connector
- Output Topic - the topic the transform will publish results to
- Click Deploy
Option B - Custom Transform
- Go to Applications → create or select an existing application
- Build, test, and publish the application
- Back on the Pipeline canvas, click + Add Transform → Custom
- Select your published application and version
- Configure input/output topics and environment variables
- Click Deploy
Step 3 - Deploy an Output Connector
An Output Connector takes the processed data and delivers it to an external destination.- Navigate to Connectors → click + Add Connector
- Select Output as the connector role
- Choose your connector type (e.g. PostgreSQL, Big Query, S3, Kafka)
- Fill in the required configuration fields:
- Title - a unique name for this connector
- Input Topic - must match the Output Topic from your Transform
- Environment Variables - destination credentials and settings
- Click Deploy
Condense automatically draws a connecting line between blocks that share matching topics. Your pipeline is now live.
Step 4 - View Your Pipeline
Click Pipeline in the left sidebar. You will see all deployed blocks connected by lines: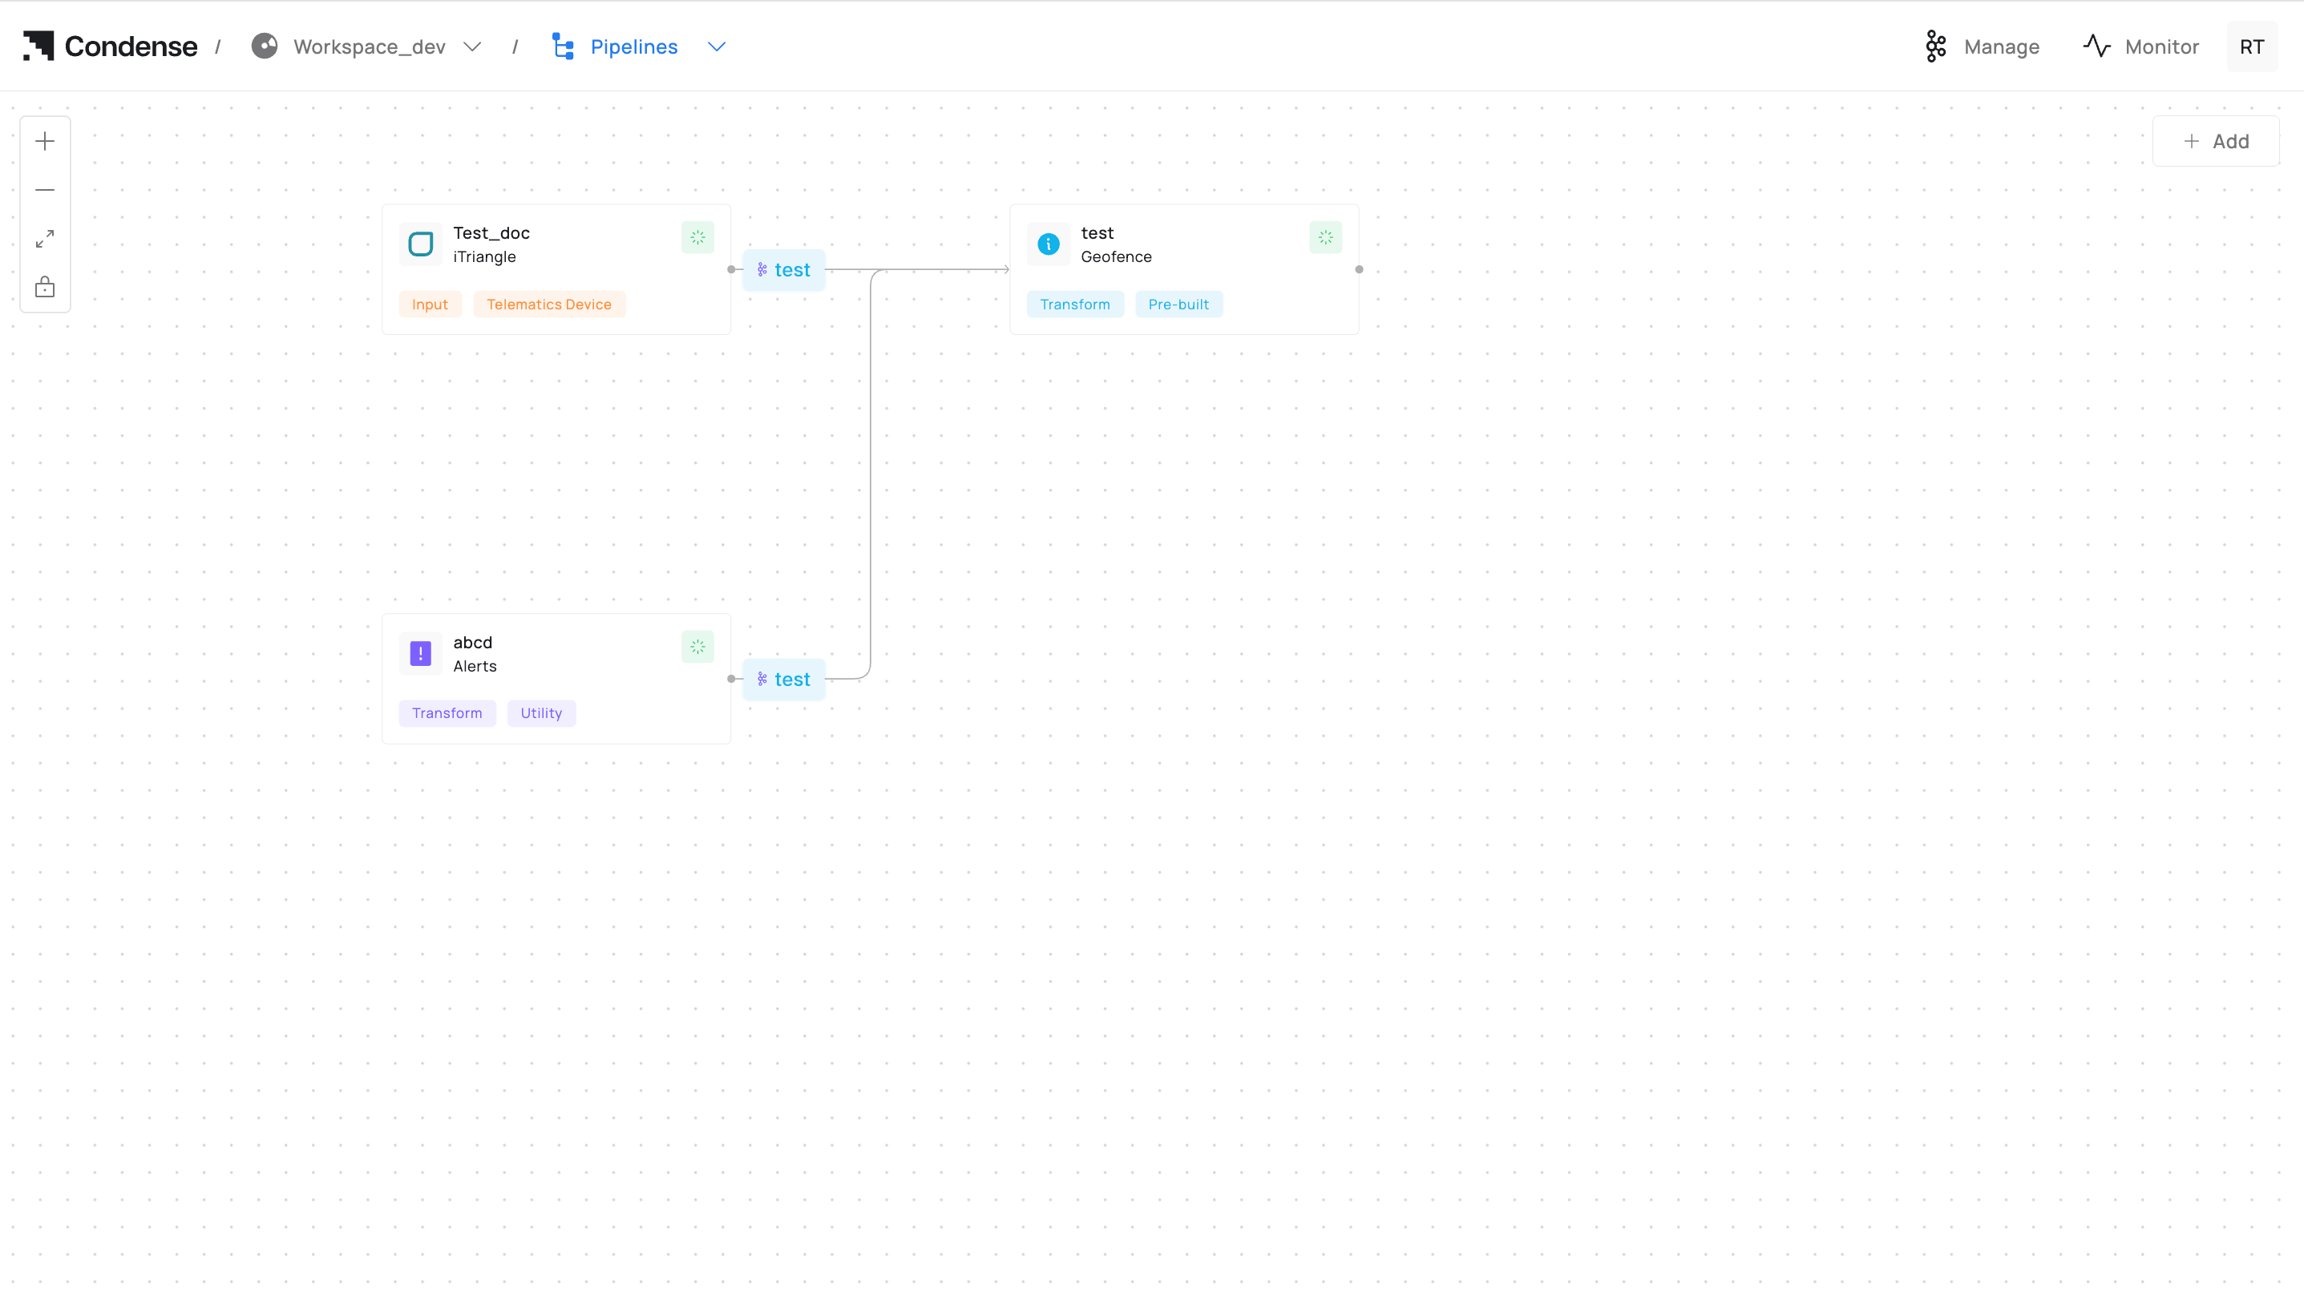
Pipeline Canvas Showing Connected Blocks
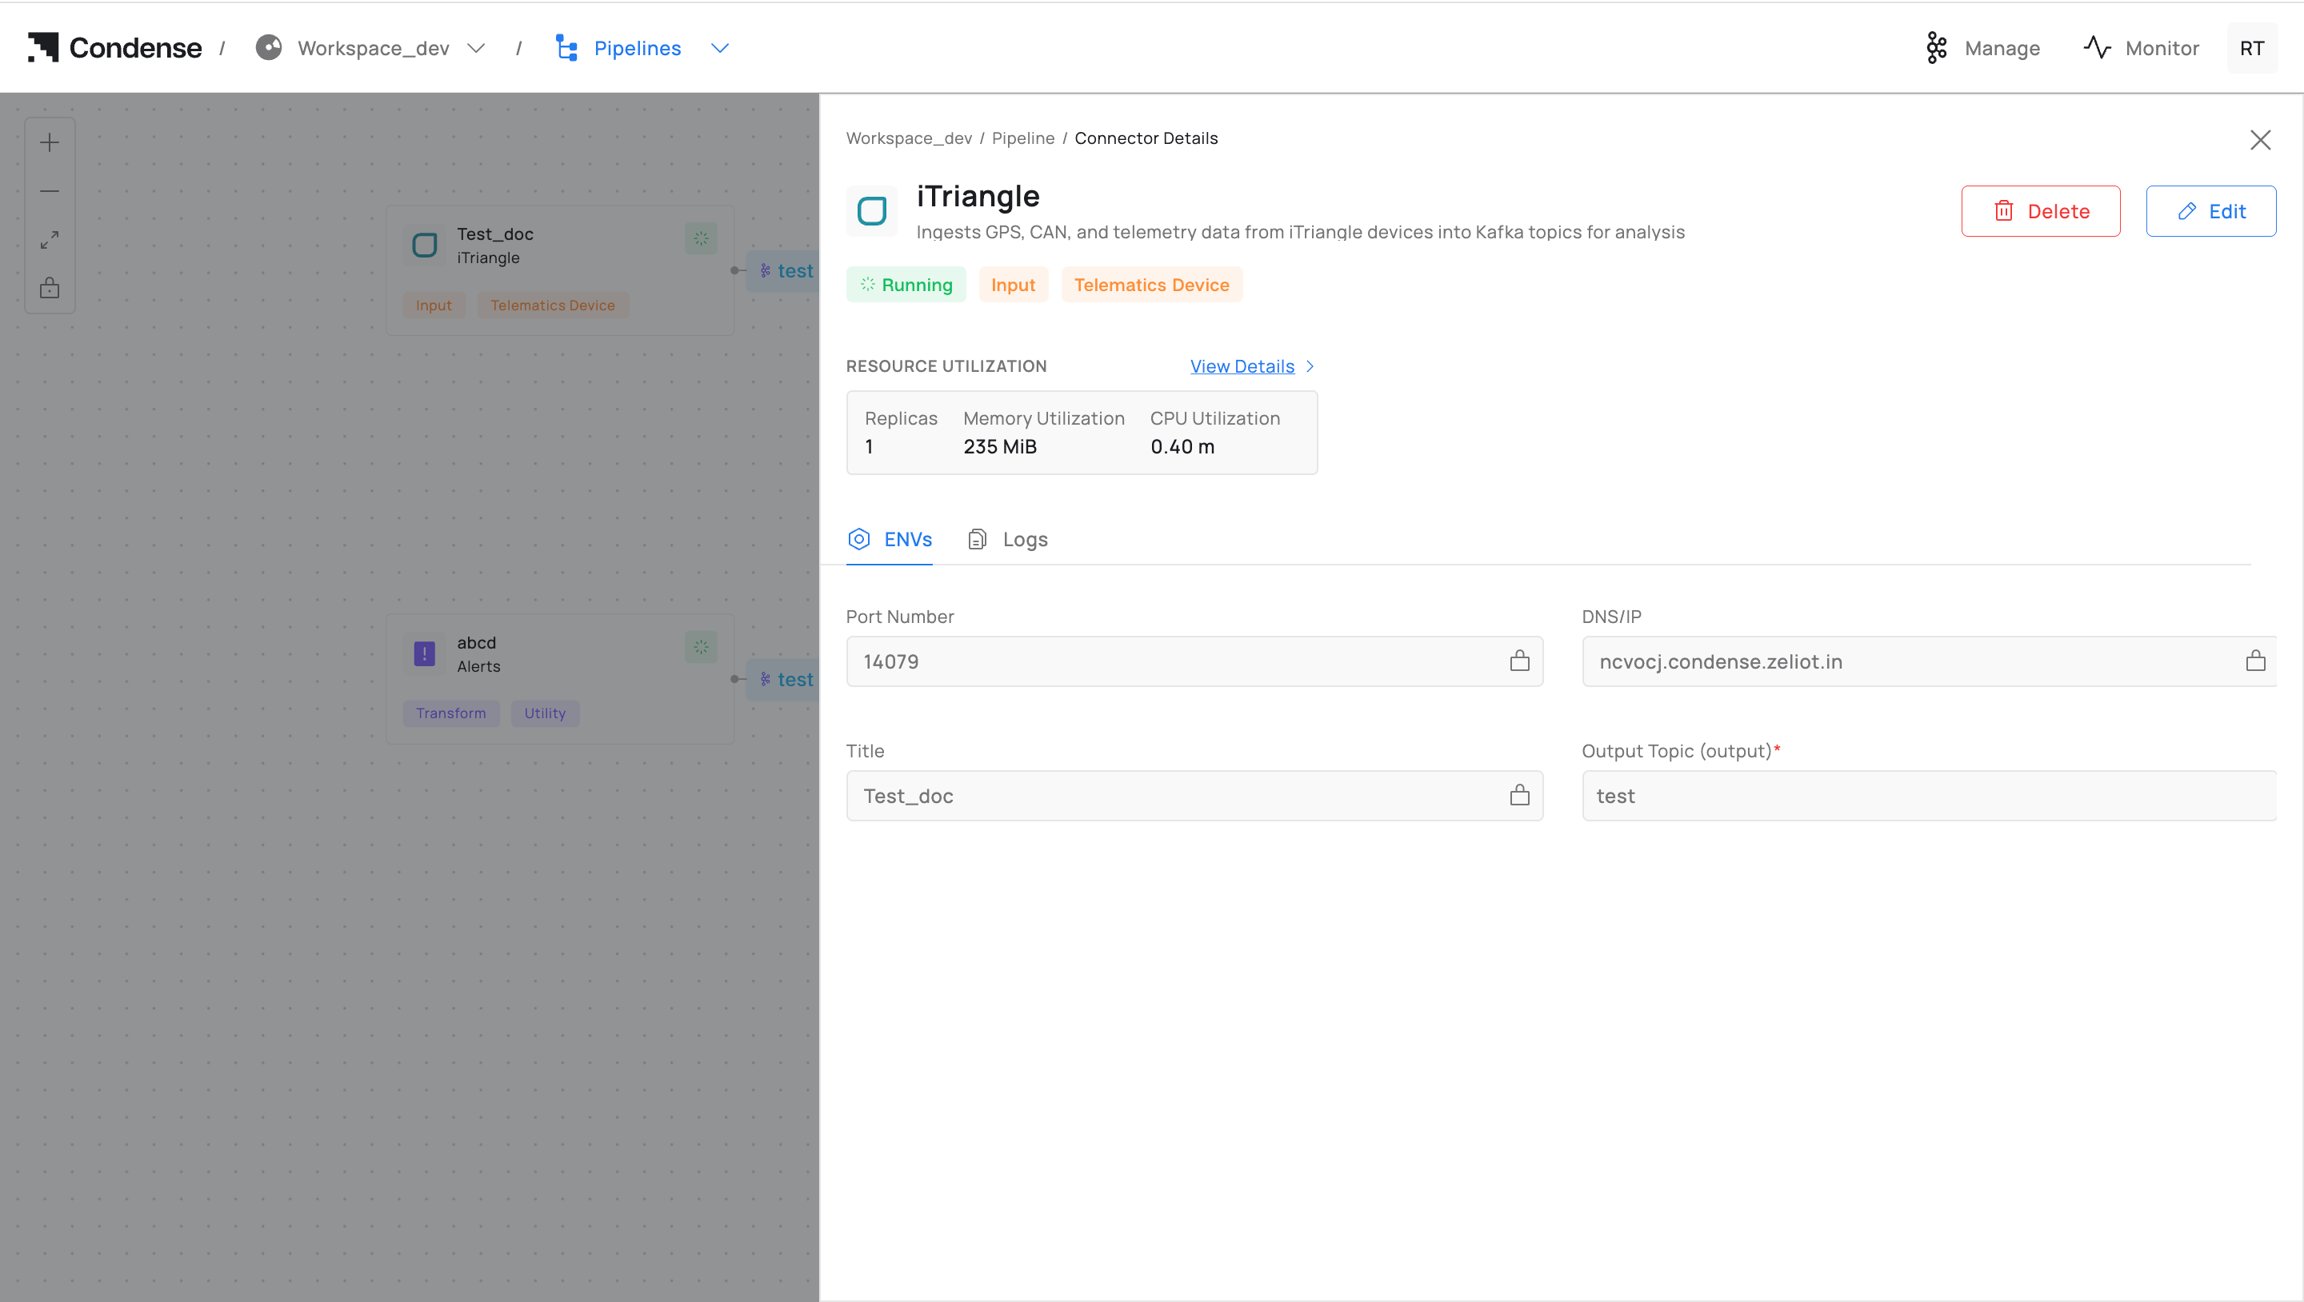
Node Details Panel
Pipelines are automatically materialized. They appear automatically as soon as connectors and transforms are deployed. You do not manually create a pipeline.
Step 5 - Monitor Your Pipeline
Real-Time Metrics
Each block displays live CPU and memory utilization: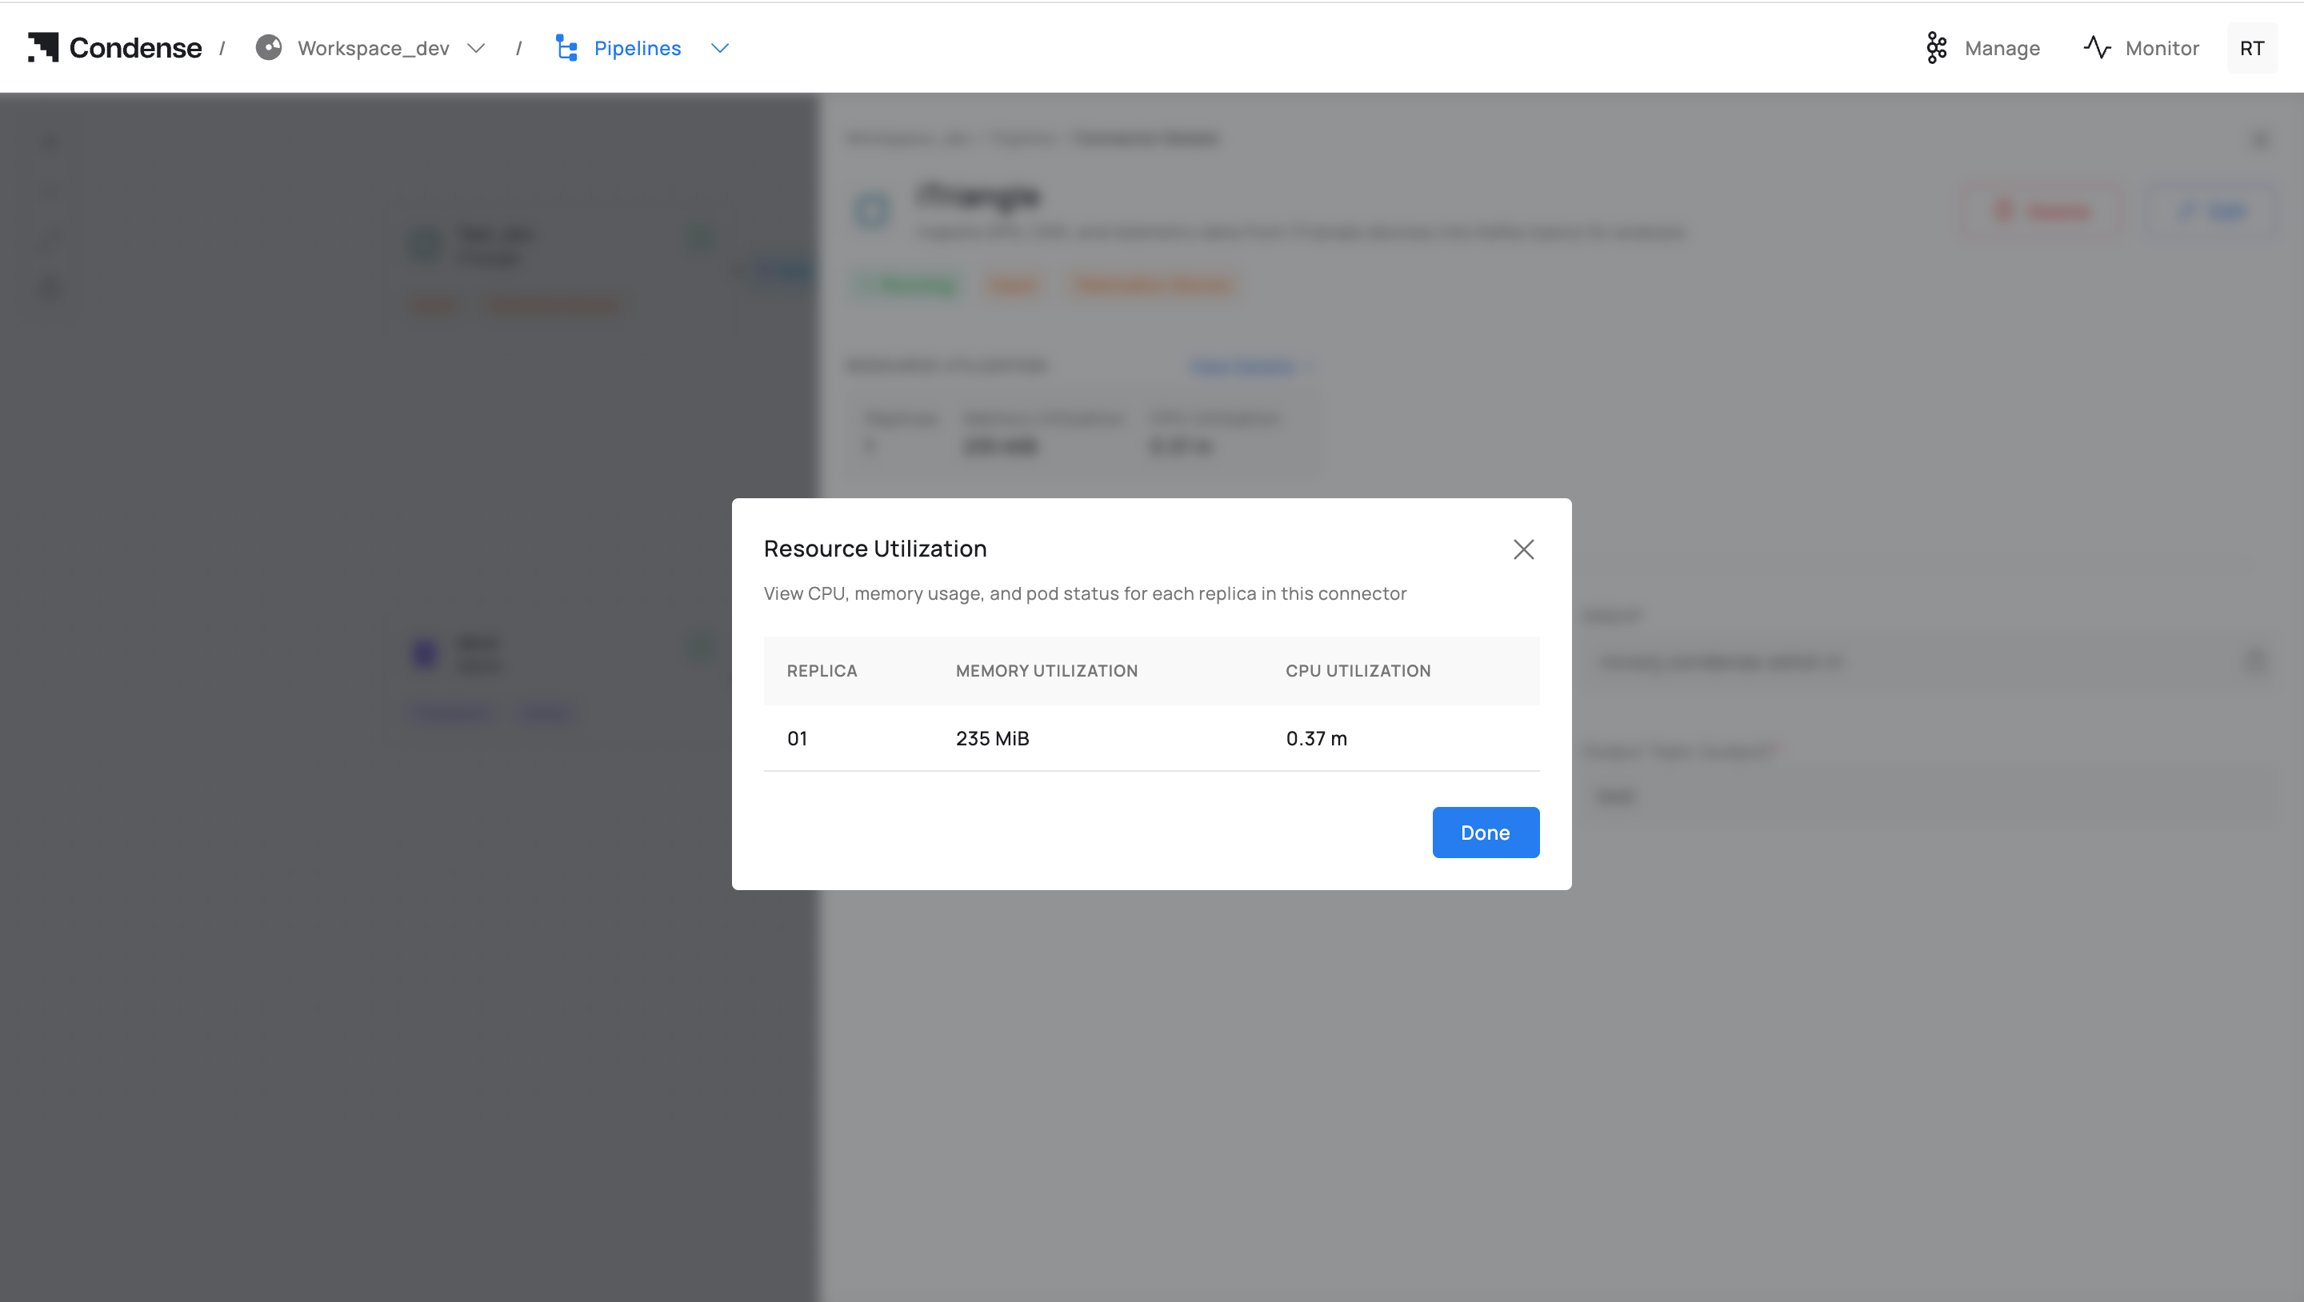
Real-Time Resource Utilization Metrics
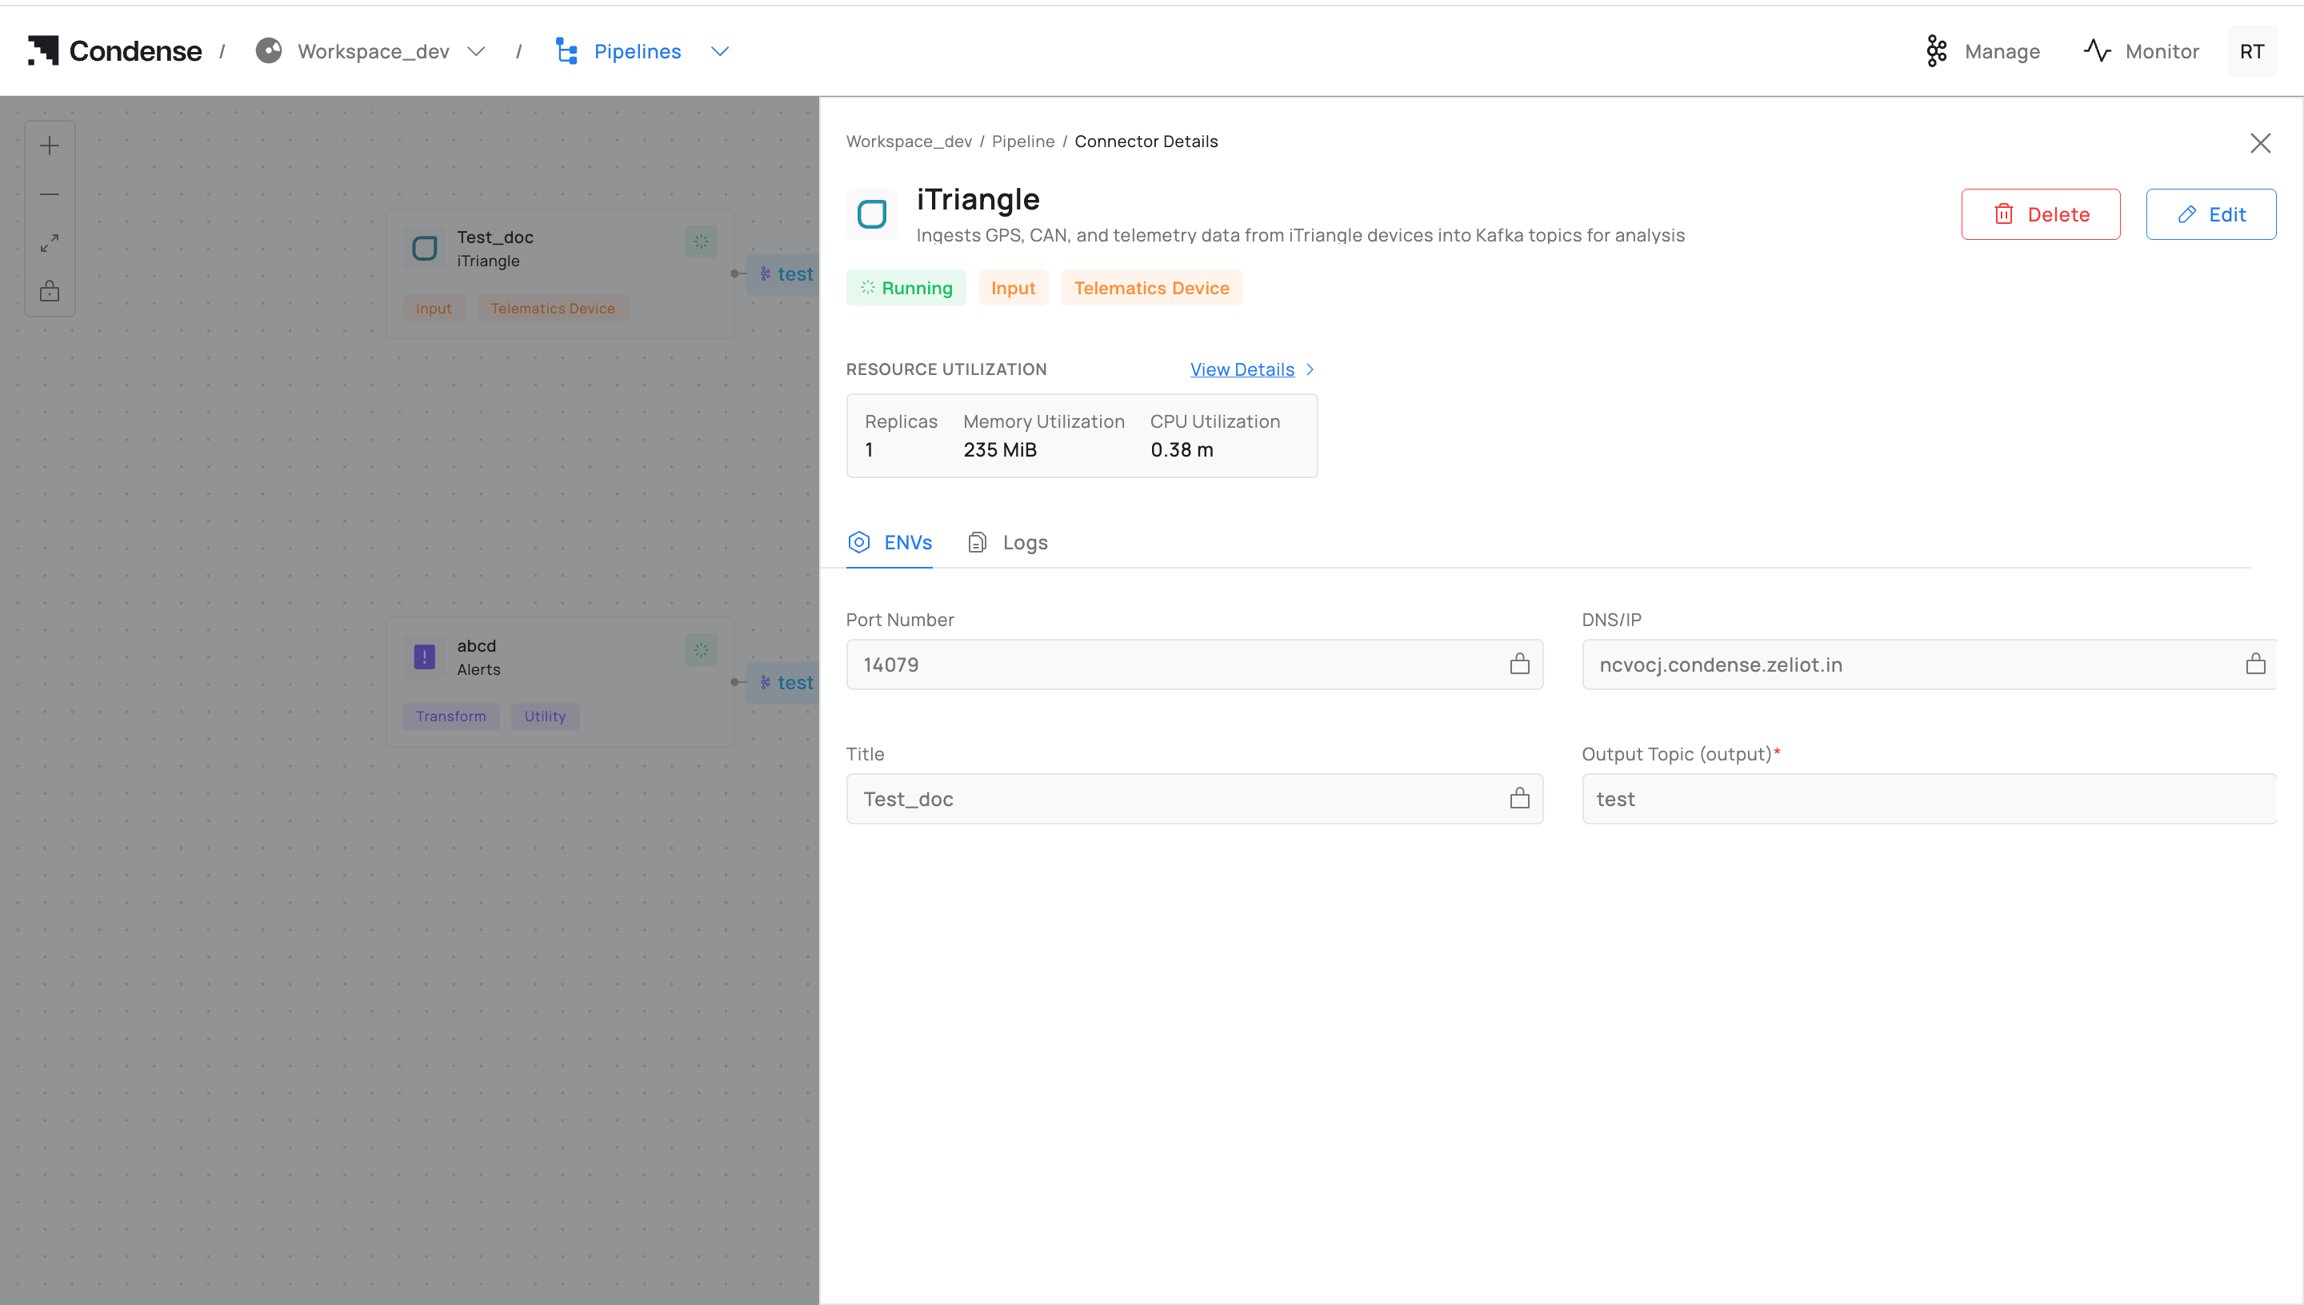
Colour-Coded Pipeline Status Indicators
Logs and Debugging
Access detailed real-time logs for each block with customizable streaming intervals (5 seconds by default):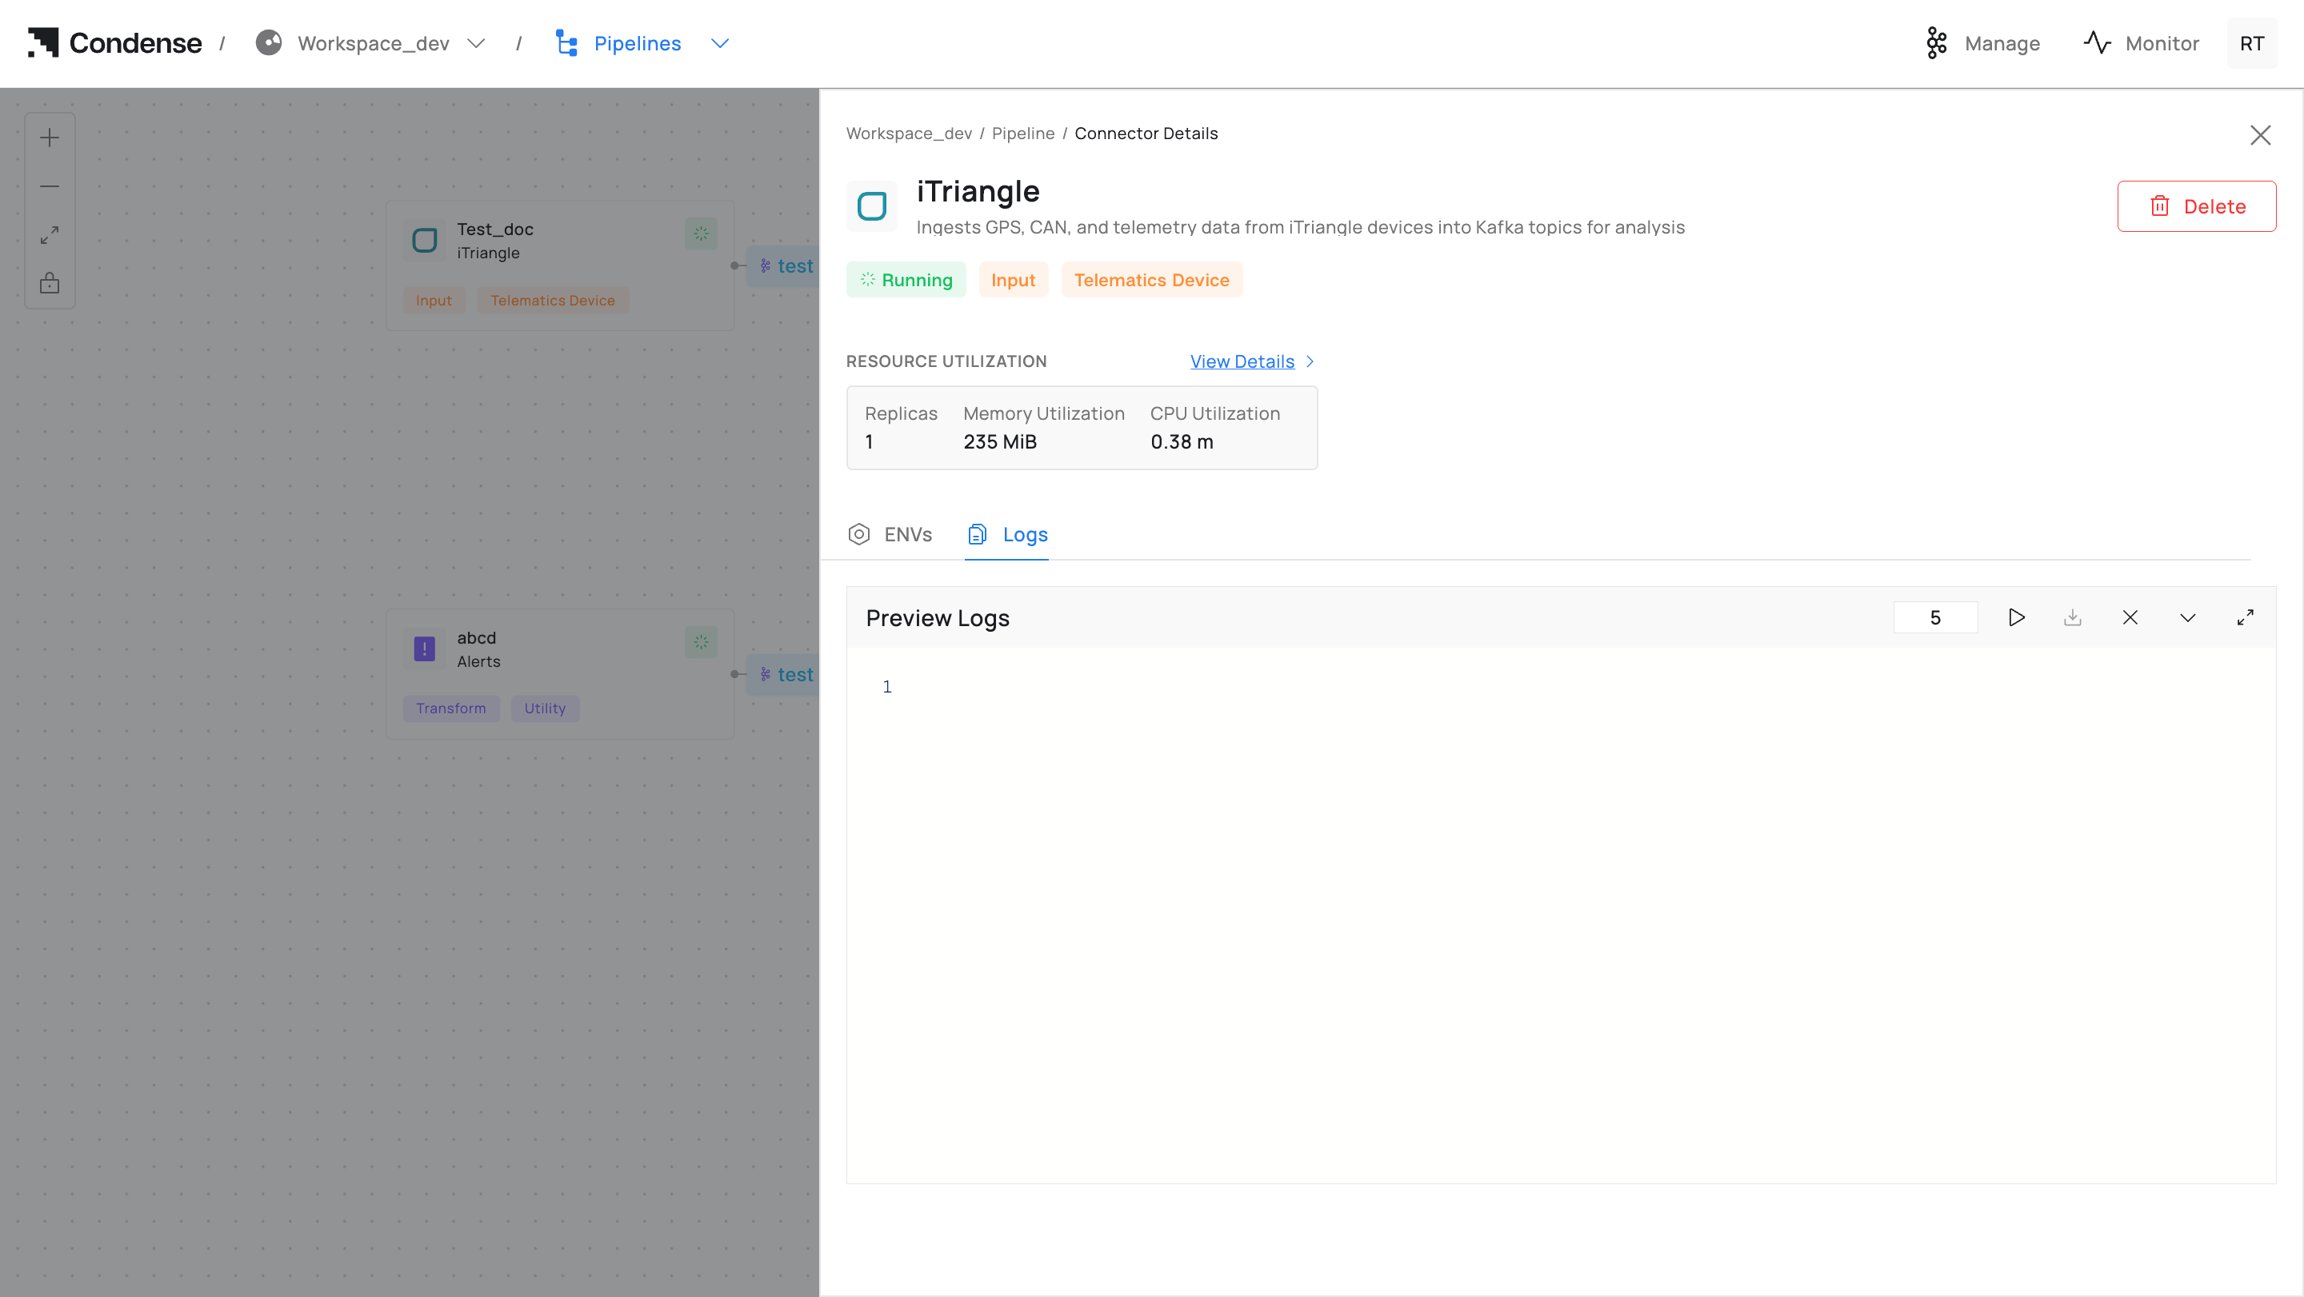
Logs and Debugging Panel
Editing Your Pipeline
If you need to fix a misconfiguration after deployment, use Edit Configurations: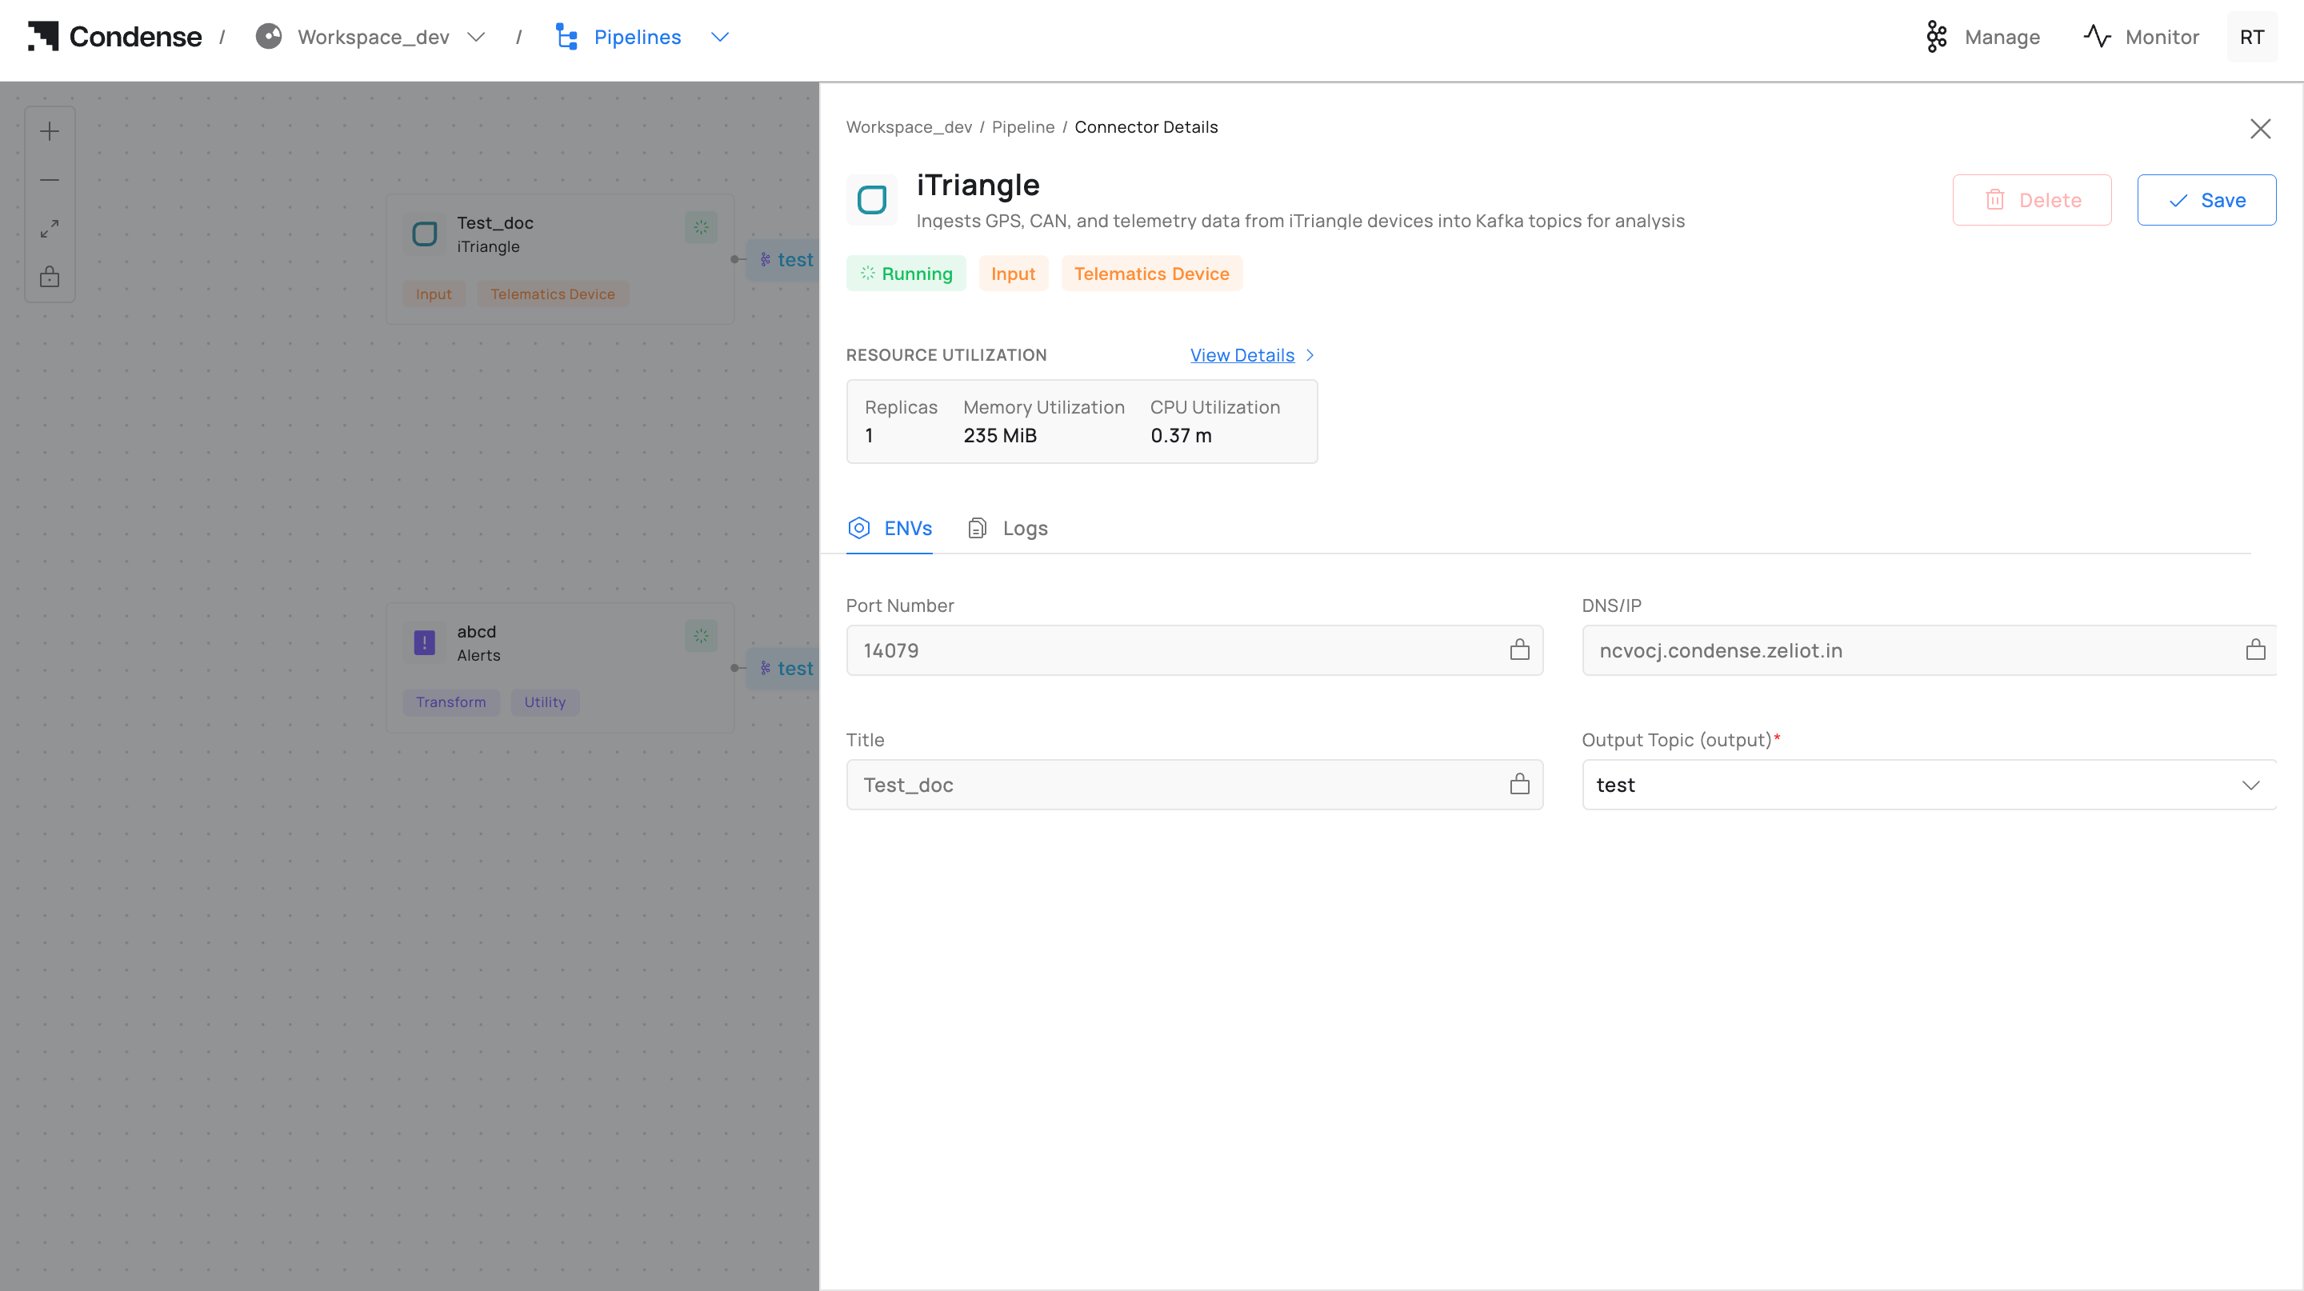
Edit Configurations Panel
- Click the block you want to edit on the Pipeline canvas
- Click Edit Configuration
- Update the required fields
- Click Save Changes
Roles and Permissions
Best Practices
✓ Use clear topic naming to make the pipeline canvas self-explanatory ✓ Group related connectors and transforms logically to simplify understanding ✓ Avoid unused topic links to reduce visual clutter ✓ Regularly check component logs to catch issues early ✓ Document the pipeline purpose in the workspace descriptionCommon Pitfalls
- Misaligned Topic Names - Double-check that Output Topic of one block exactly matches the Input Topic of the next block
- Unused Components Left Running - Remove or disable unused connectors to prevent unnecessary resource usage
- Overcrowded Canvas - Use multiple workspaces when a single pipeline becomes too dense